>_ How I Automated Broiler Farm FCR Calculations and Replaced Paper Logs with Real-Time Telemetry
Building a production Flutter management system for broiler farms: daily feed recording, depletion tracking, automated Feed Conversion Ratio (FCR) & Performance Index engines, and real-time multi-shed sync on Firebase.
Get it on Google Play ↗- 01Flutter UI LayerReactive forms & FCR dashboard cards
- 02Domain / FCR EngineAutomated FCR, depletion & IP calculation
- 03Repository LayerState sync & validation rules
- 04Firebase / FirestoreReal-time cloud persistence & auth
Figure 1.0 — End-to-end architecture and data flow for BroilerKu
# The Journey Overview
A broiler coop management app that replaces paper records with automatic feed efficiency (FCR) calculation.
The Starting Point (Problem)
Farmers logged feed, mortality, and daily weight on paper or in chat messages, so Feed Conversion Ratio (FCR) calculation was slow and error-prone.
Why This Matters (Outcome & Impact)
Cut the time spent on daily coop summaries and put harvest performance indicators (FCR & Performance Index) instantly on the farmer's phone.
# Phase 1: System Architecture & Pipeline
The system architecture is designed to be modular so each layer has a clearly isolated responsibility:
Flutter UI Layer
Reactive forms & FCR dashboard cards
Domain / FCR Engine
Automated FCR, depletion & IP calculation
Repository Layer
State sync & validation rules
Firebase / Firestore
Real-time cloud persistence & auth
Core Technical Deliverables
- Daily feed, depletion (mortality), and weight sampling records per coop
- Automatic FCR (Feed Conversion Ratio) calculation & real-time harvest estimates
- Multi-coop data sync built on Cloud Firestore & Firebase Auth
# Phase 2: Engineering Decisions & Implementation
class FcrCalculator {
  static double compute({
    required double totalFeedKg,
    required int livePopulation,
    required double avgWeightKg,
  }) {
    final totalBiomassKg = livePopulation * avgWeightKg;
    if (totalBiomassKg <= 0) return 0.0;
    return double.parse((totalFeedKg / totalBiomassKg).toStringAsFixed(2));
  }
}
# Phase 3: Application Screens & Operational Workflow
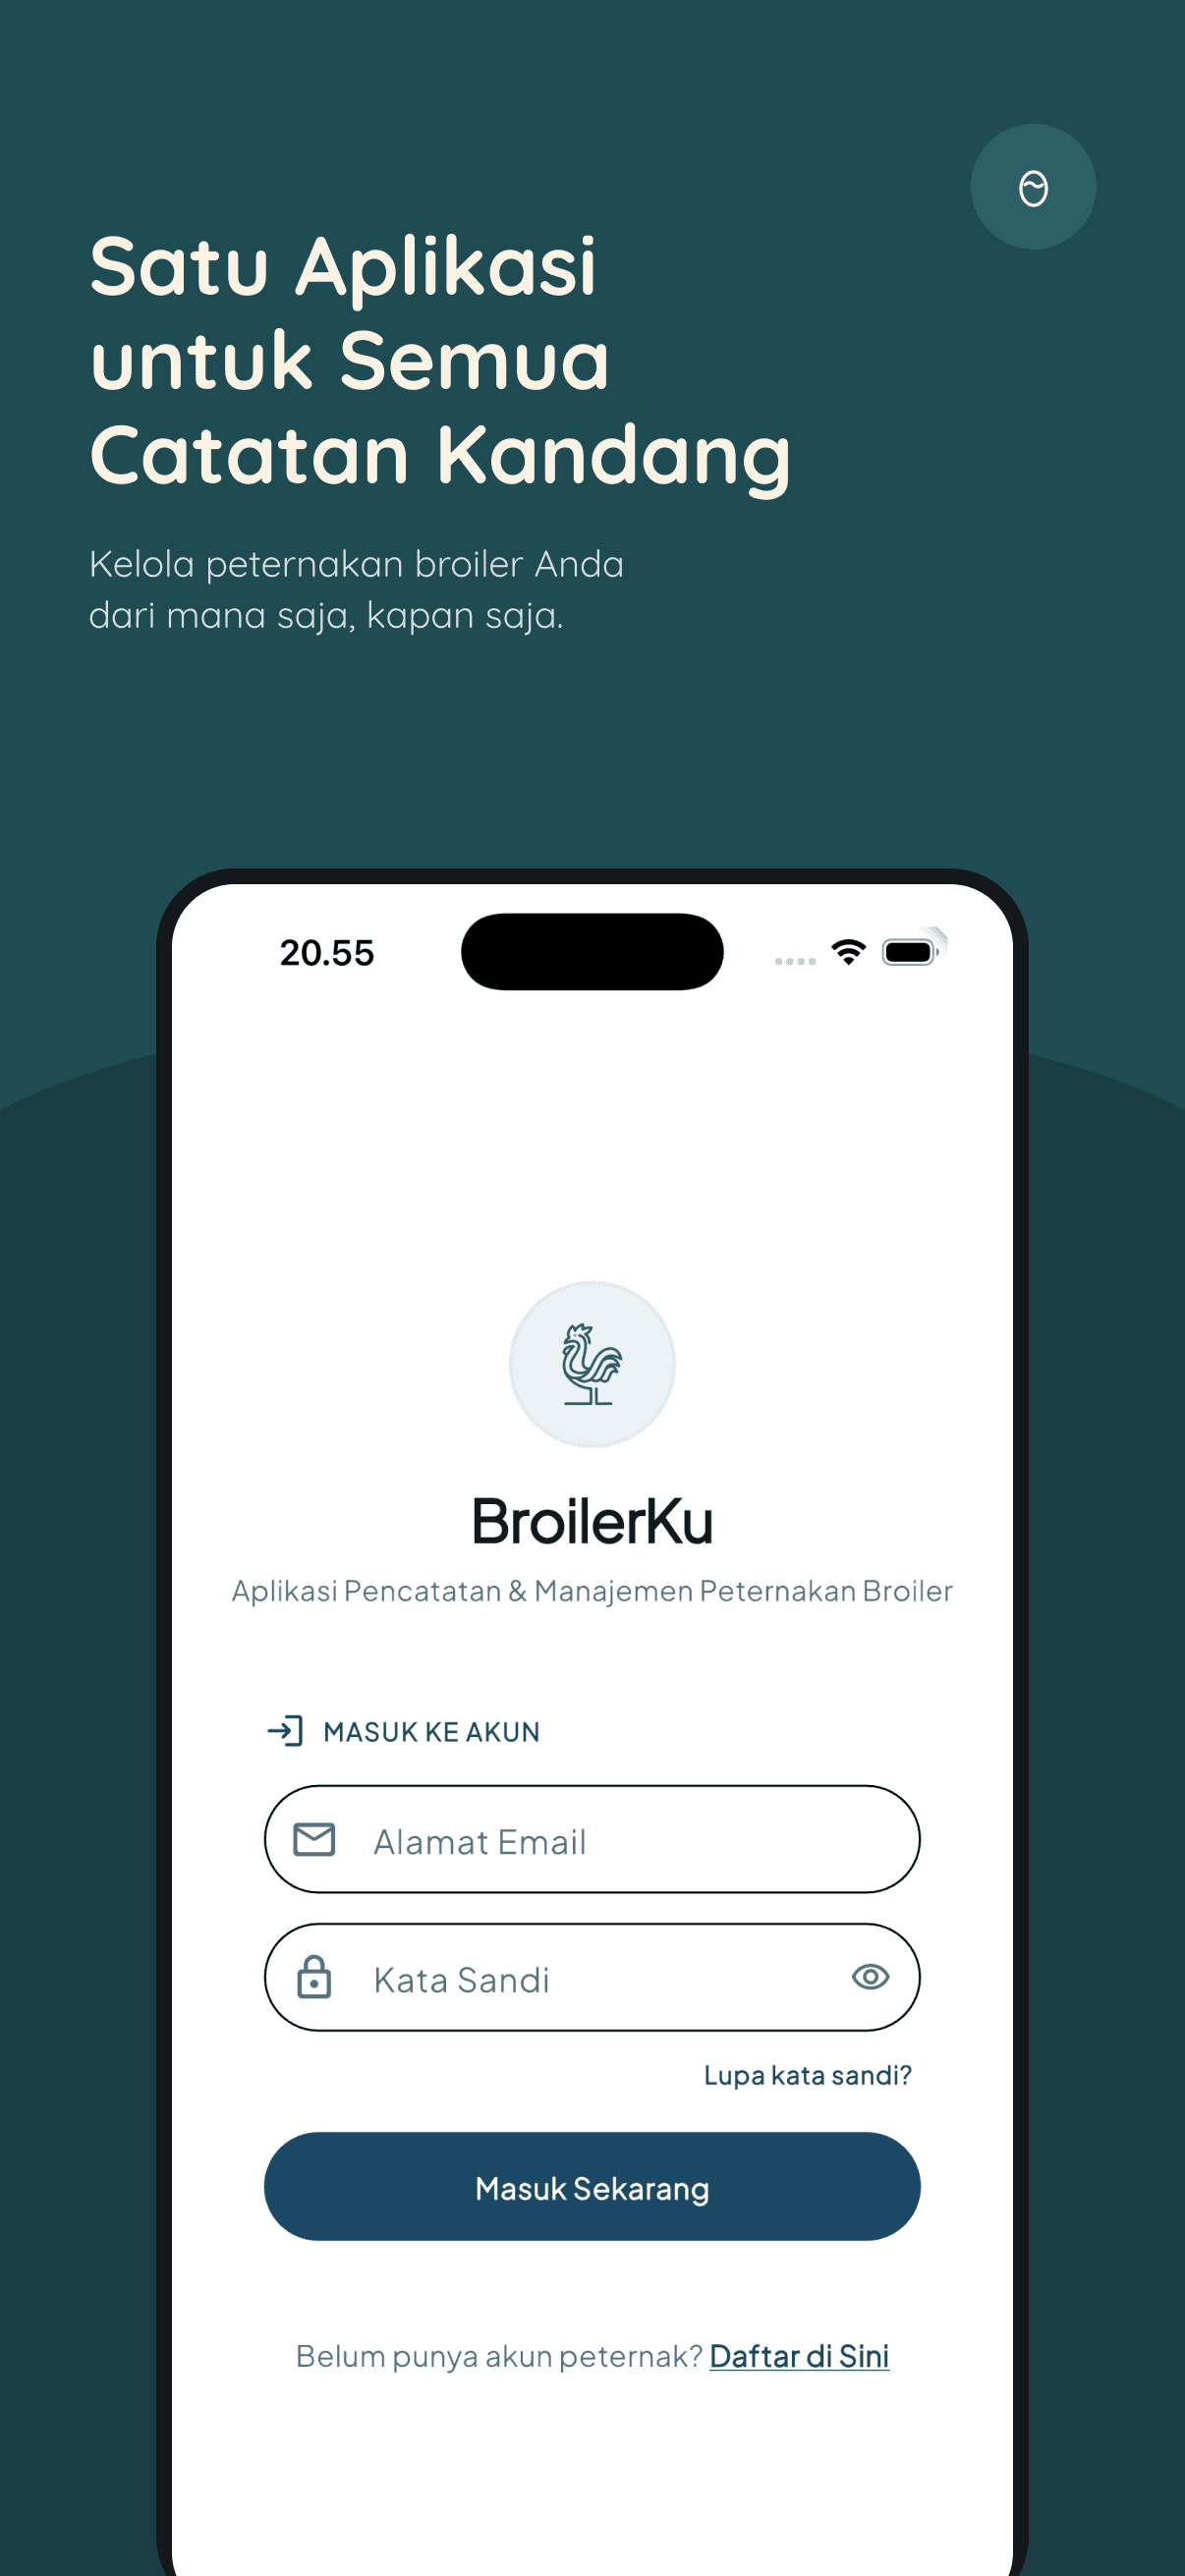
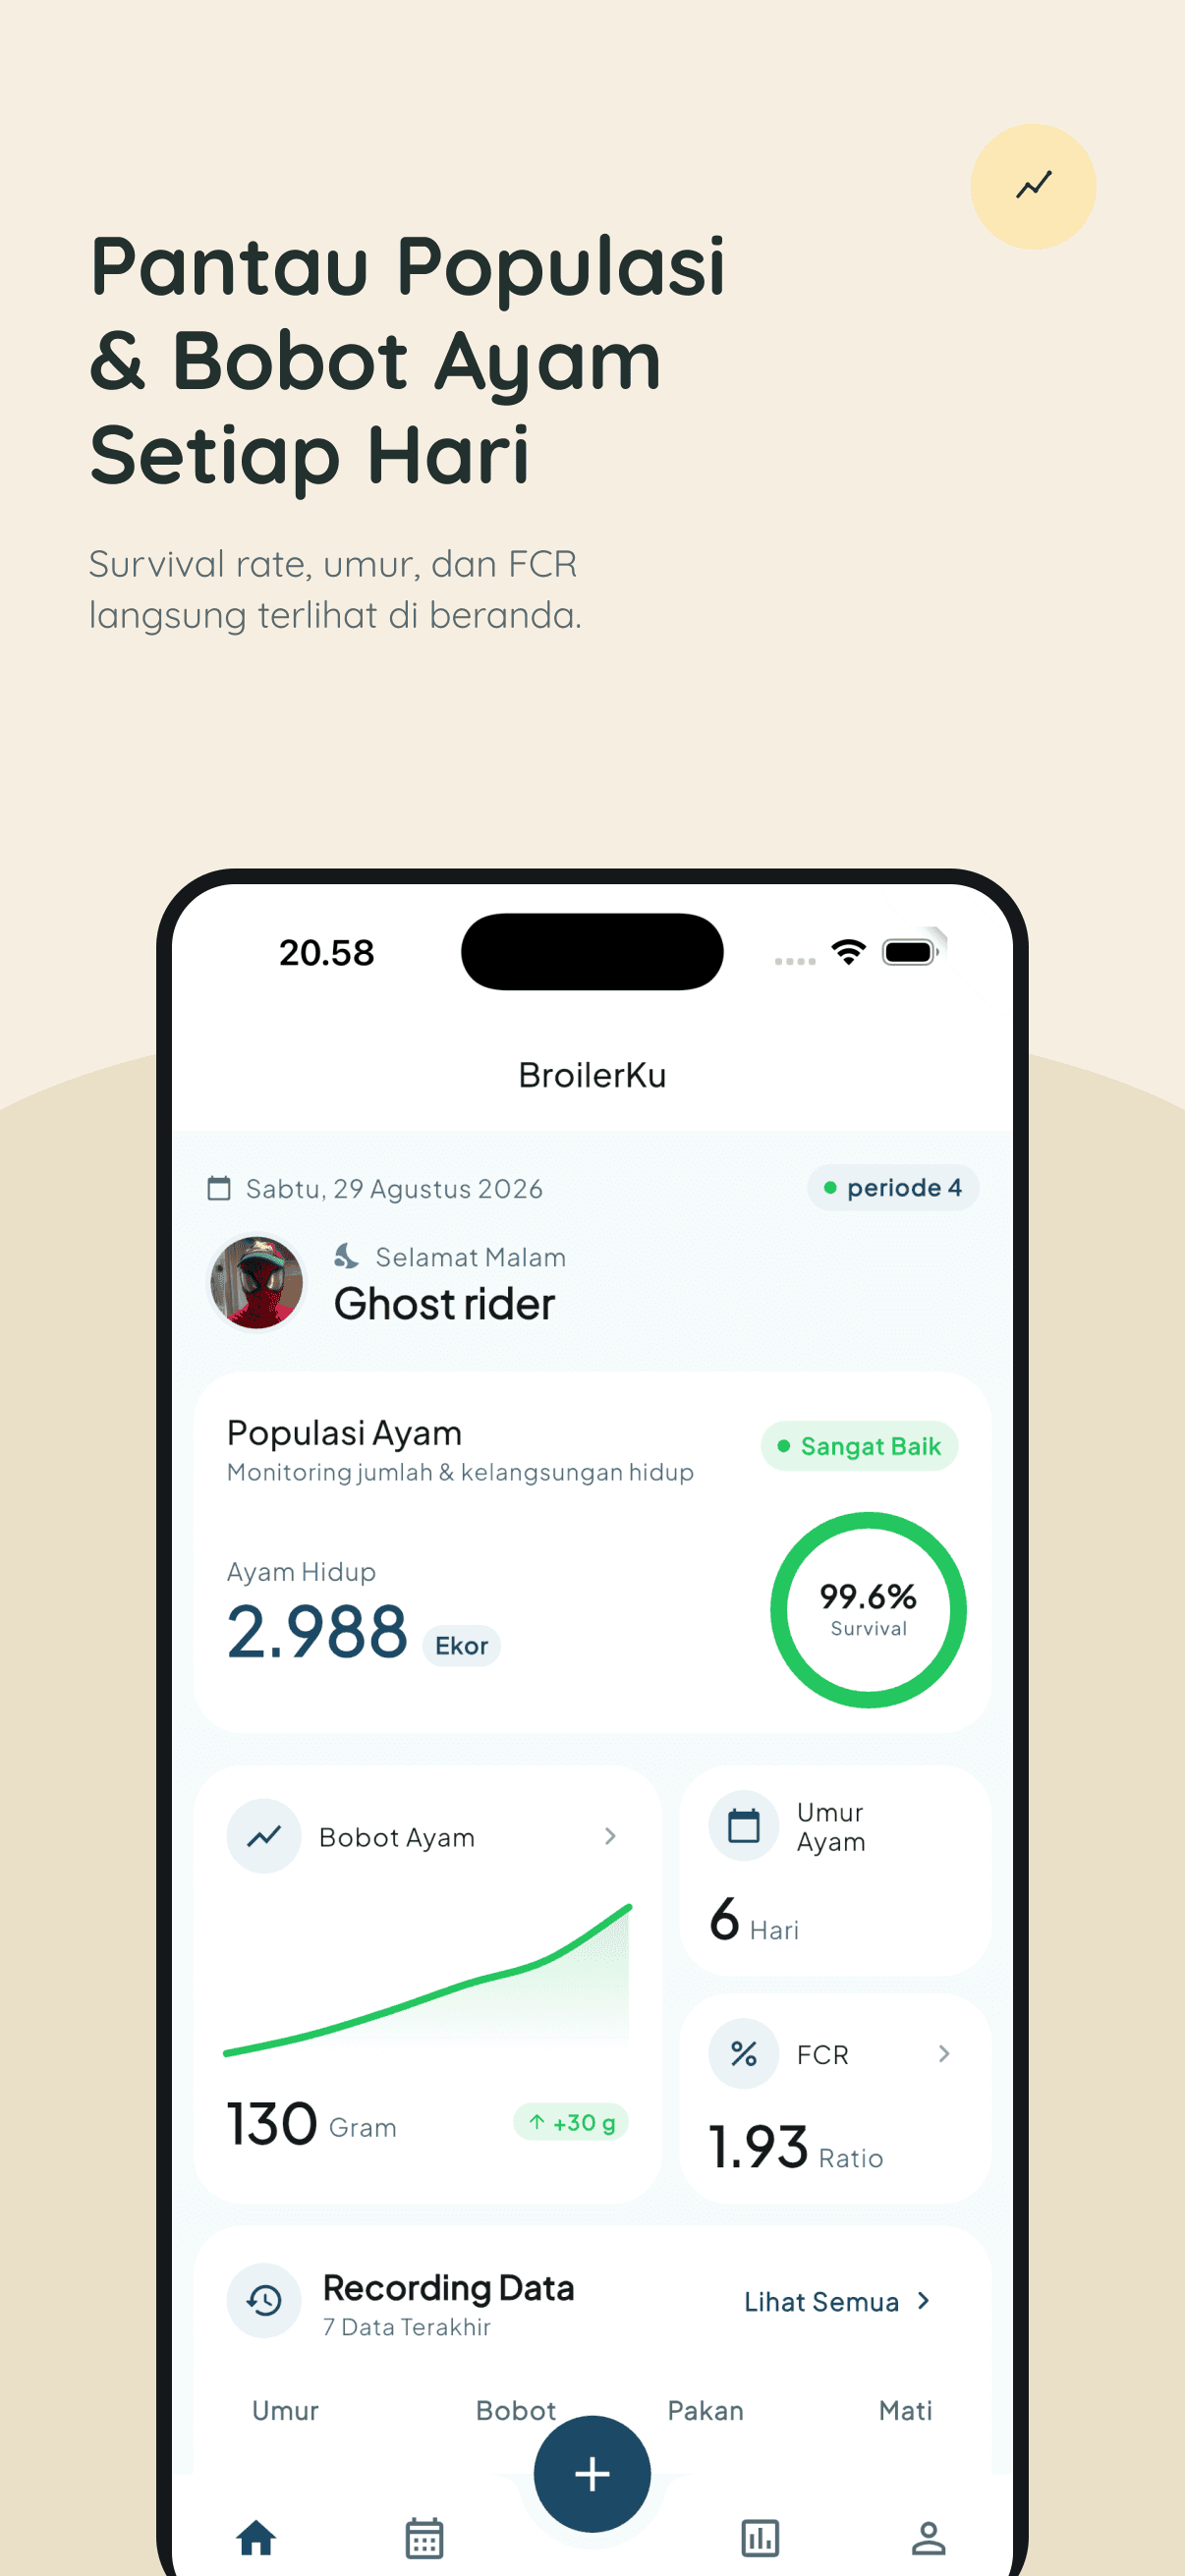
1. Coop Dashboard
Key metrics at a glance: current FCR score, live population, and a feed consumption chart.
2. Quick Daily Input
A form to record incoming feed, daily mortality, and sample weighing results.
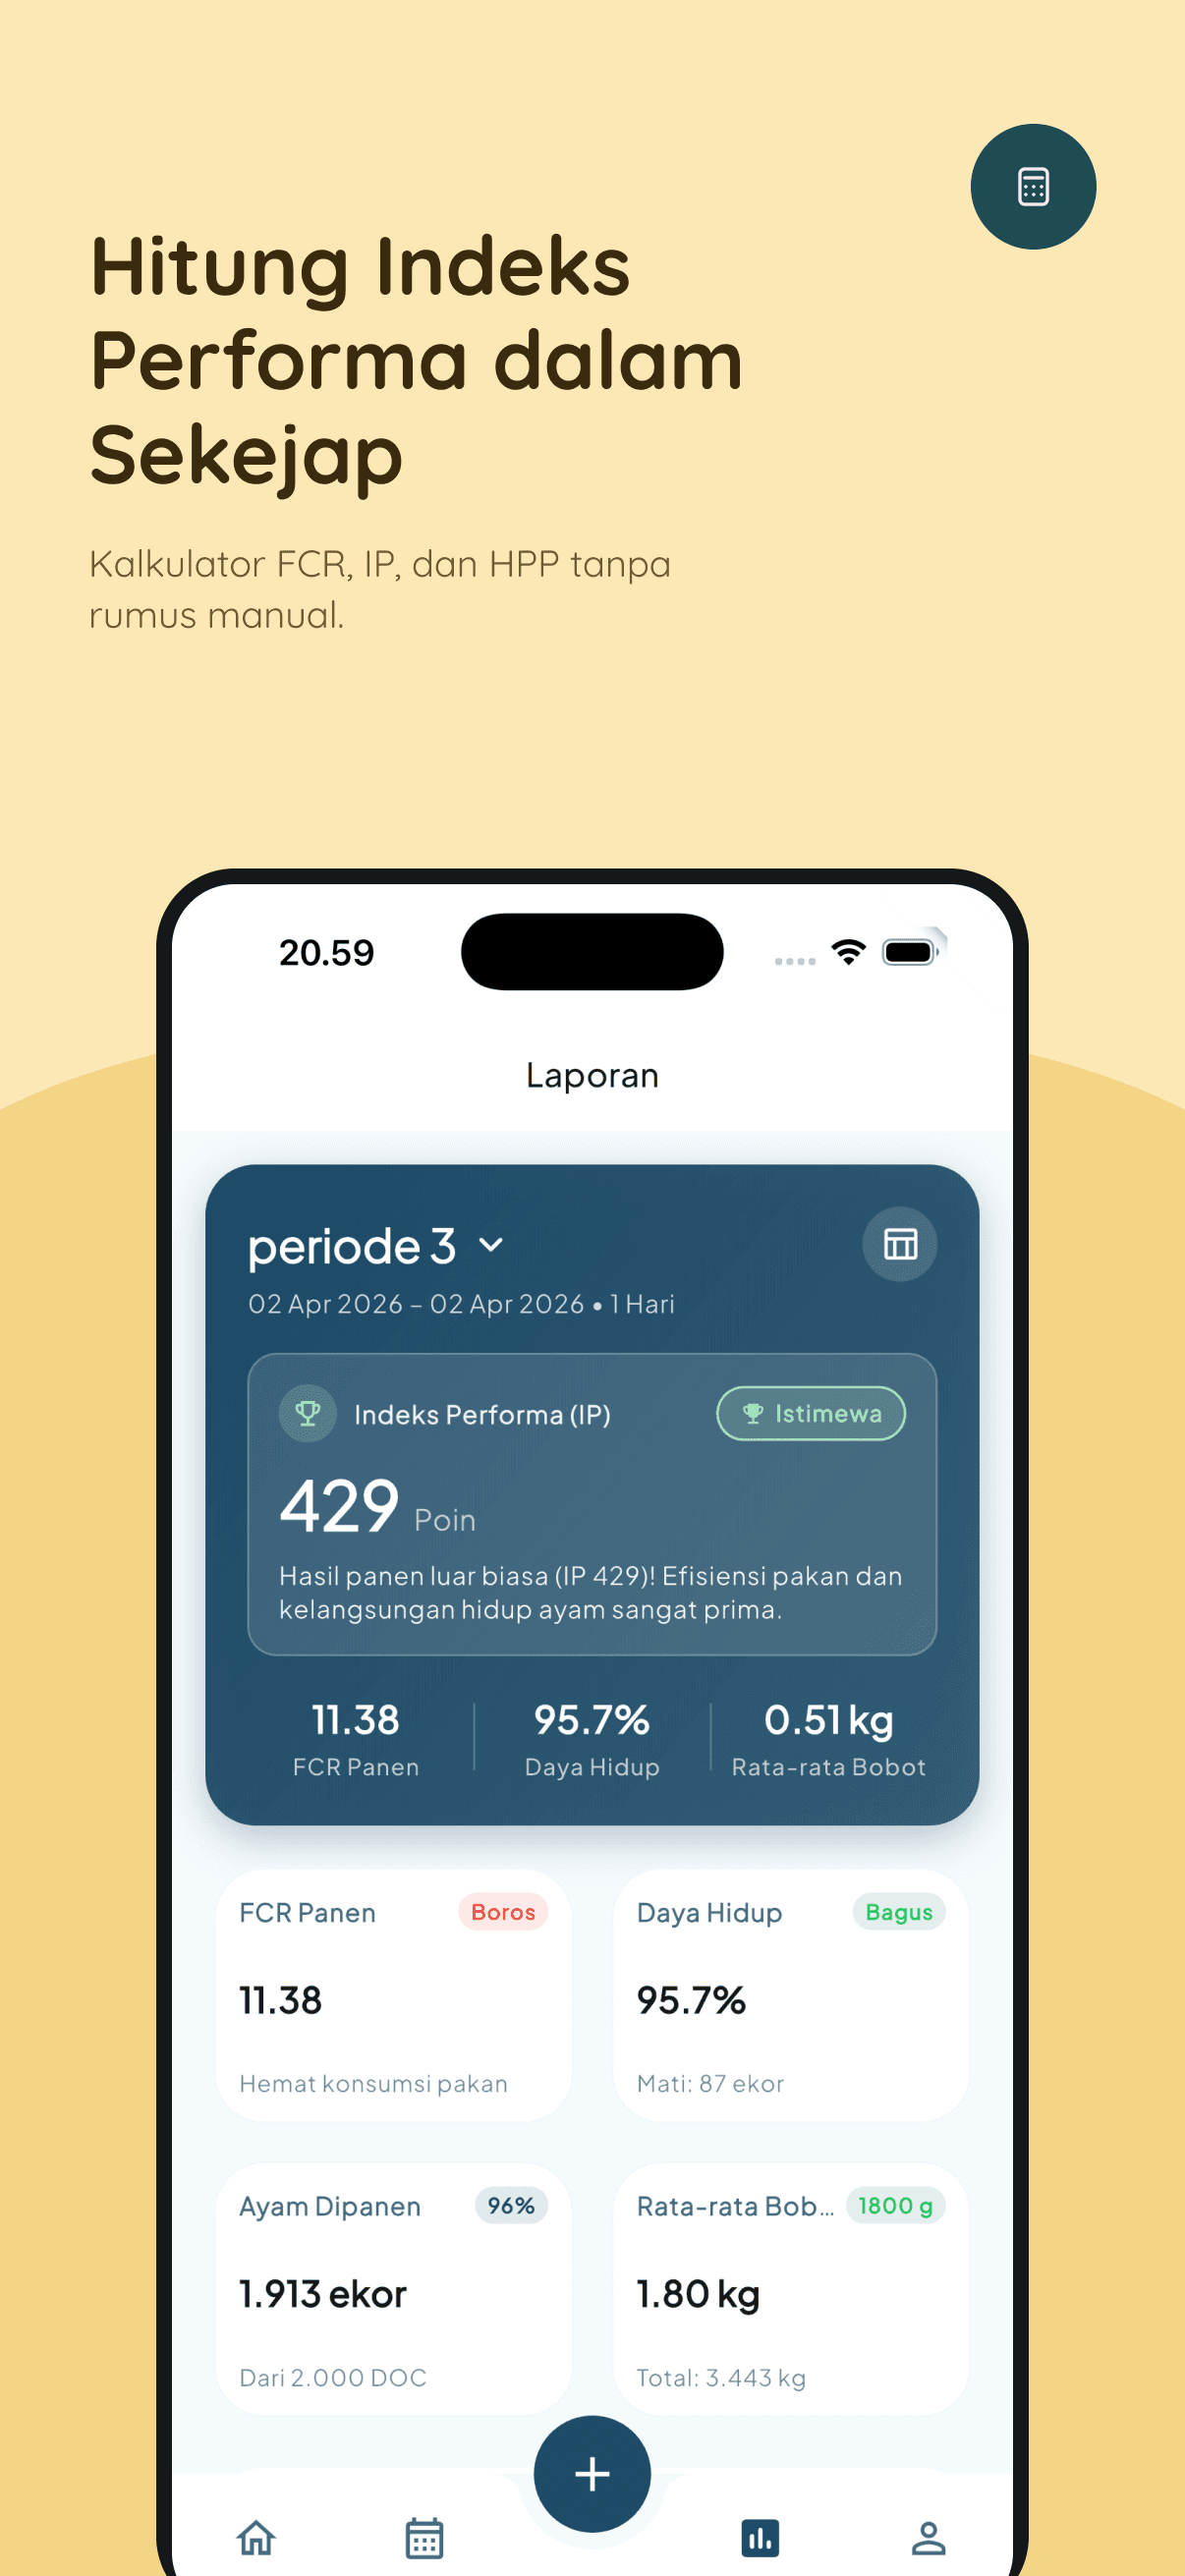
3. Harvest Cycle Analytics
Coop performance review from day 1 (DOC) to harvest to compare efficiency.